Error tracking
Error tracking with the session replay attached
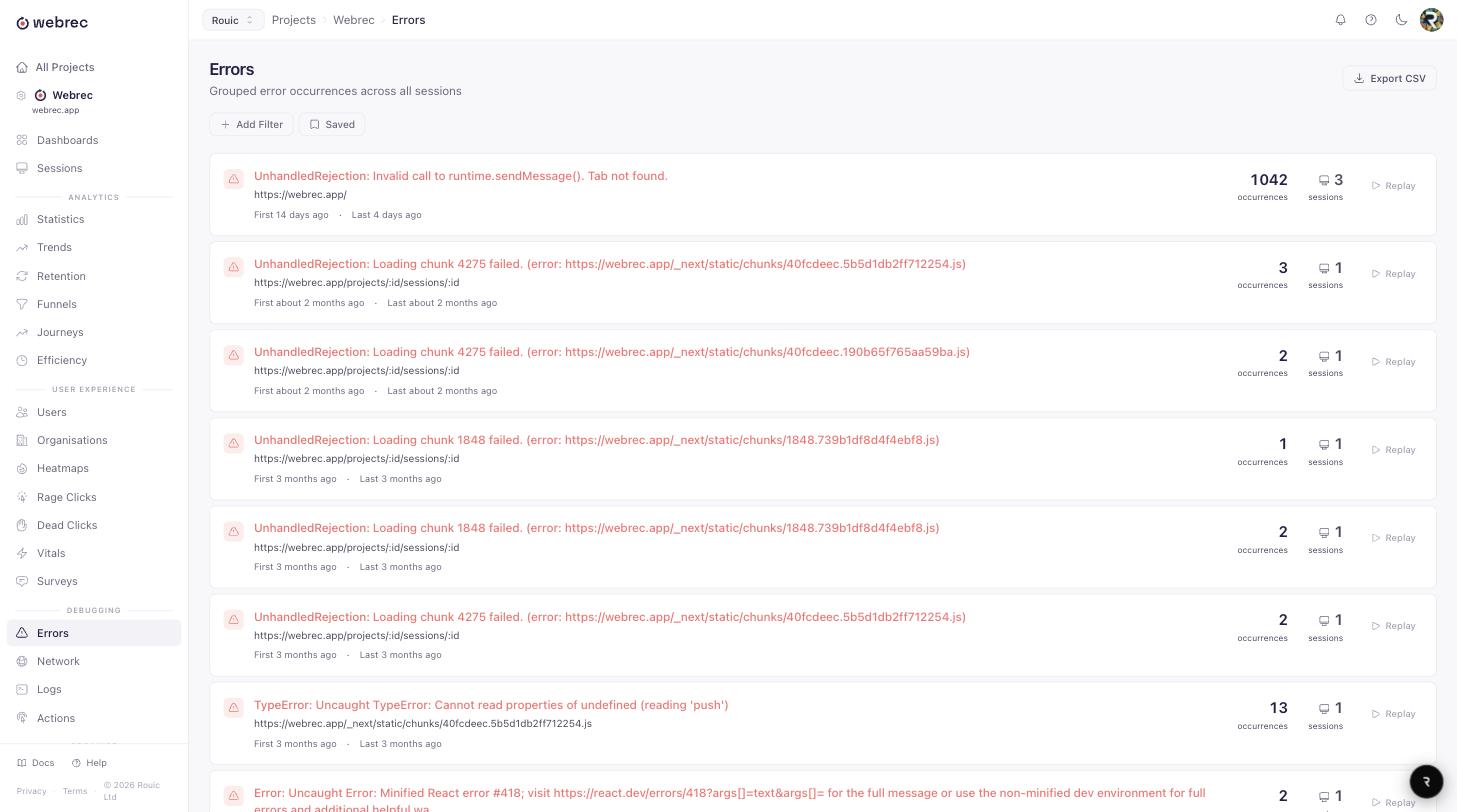
A stack trace tells you where your code broke. It rarely tells you why. Webrec captures uncaught exceptions and unhandled promise rejections, groups them by stack trace fingerprint, and links every single occurrence to the recording at the exact moment it happened. You watch what the user did, read what the network returned, and check what the console printed, all in one place.
100 sessions a month on the free plan, every feature included, no credit card.
What gets captured
JavaScript error monitoring is on by default when you initialise the SDK. There is no separate agent, no second script tag, and nothing to wire into your framework’s error boundary before it starts working.
Uncaught exceptions
Anything that reaches window.onerror is recorded with its type, message, source file, line, and column. The SDK does not swallow the error or change its behaviour: it listens, records, and gets out of the way.
Unhandled promise rejections
The rejections that never show up in a try/catch block are captured through unhandledrejection, including the rejection reason and the stack where one exists. These are usually the failures nobody notices until a user complains.
Full stack traces
Every occurrence keeps its stack trace with source file, line, and column. Upload your source maps and the trace resolves back to your original file names and line numbers instead of a single minified bundle.
Console output
log, warn, error, and info are captured in order and timestamped against the replay. The warning your code printed two seconds before the exception is right there, not lost in a browser you cannot reach.
Network activity
fetch and XHR calls are recorded with status codes, timing, and request and response bodies under 16 KB. A 500 from your own API next to a red console line usually answers the question on its own.
The session around it
Browser, operating system, device, viewport, page URL, and the identified user if you call identify(). Every error group lists the sessions and users it affected, so you can tell one unlucky person from a broken release.
How grouping actually works
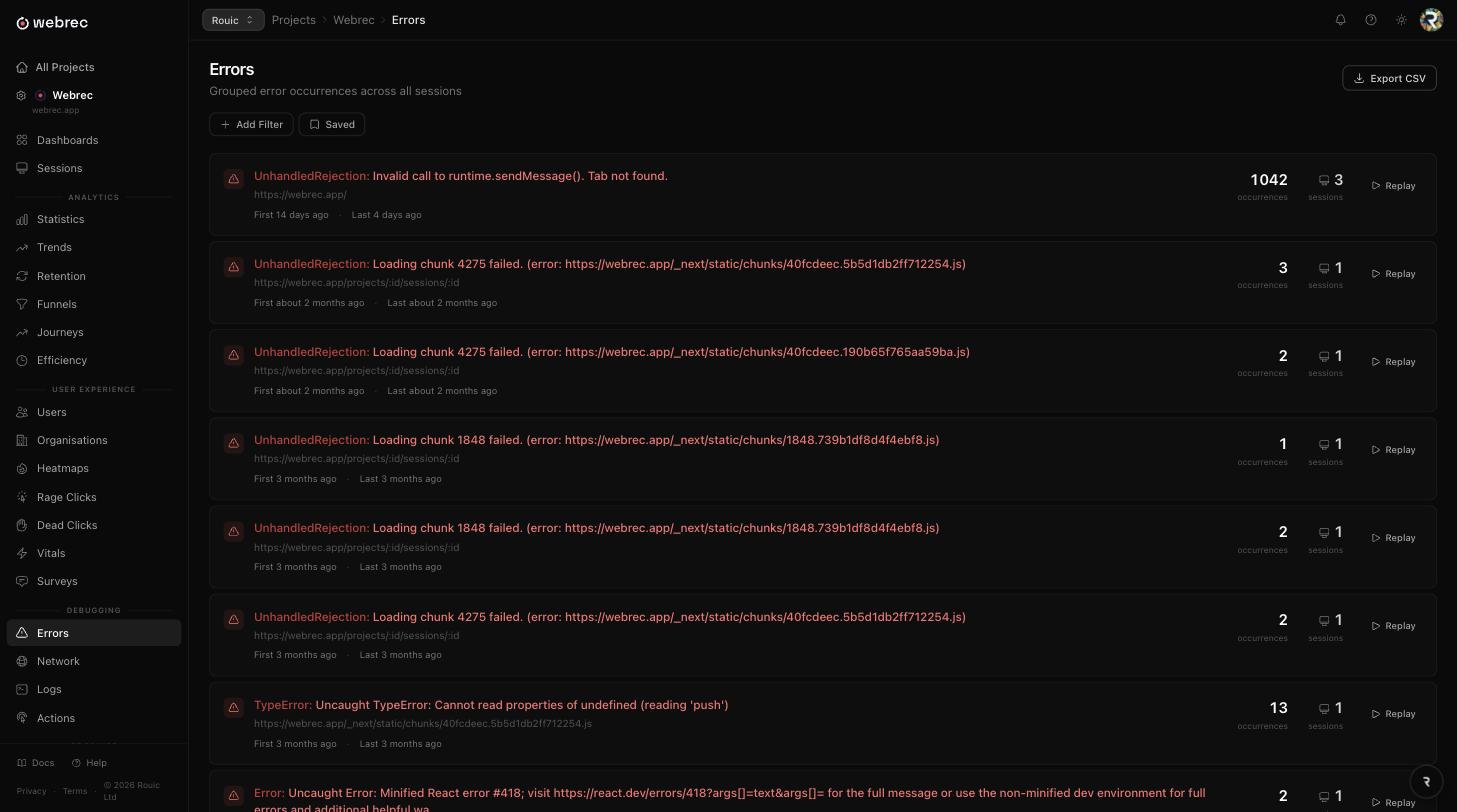
Errors are grouped by error type plus a fingerprint derived from the stack trace. Two occurrences of TypeError raised from the same frames land in the same group; the same message thrown from a different call path does not. That distinction matters, because a generic message like “Cannot read properties of undefined” can come from four unrelated bugs in the same afternoon.
Each group carries a first occurrence, a last occurrence, a total count, and the list of sessions it touched. Those four numbers do most of the triage for you. A group with a first occurrence timestamped an hour ago and a count climbing fast is a regression you just shipped. A group that has been quietly firing for three months across two sessions is a browser quirk you can schedule rather than panic about.
You can filter the list by error type, message, page URL, date range, and occurrence count. Because errors are attached to sessions rather than floating free, you can also go the other way: open a session that looks bad, see which errors fired inside it, and jump to the group from there.
Debug errors with session replay
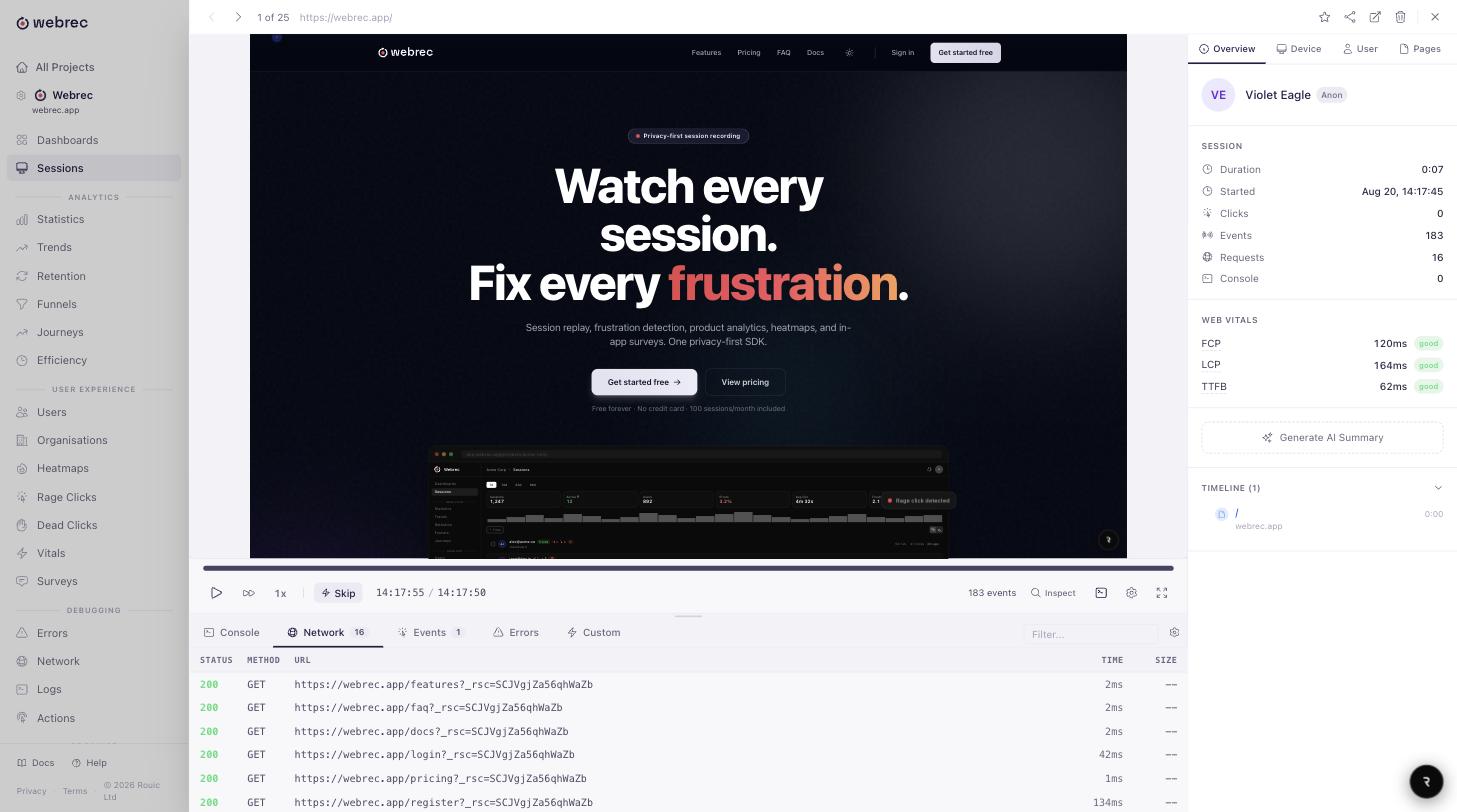
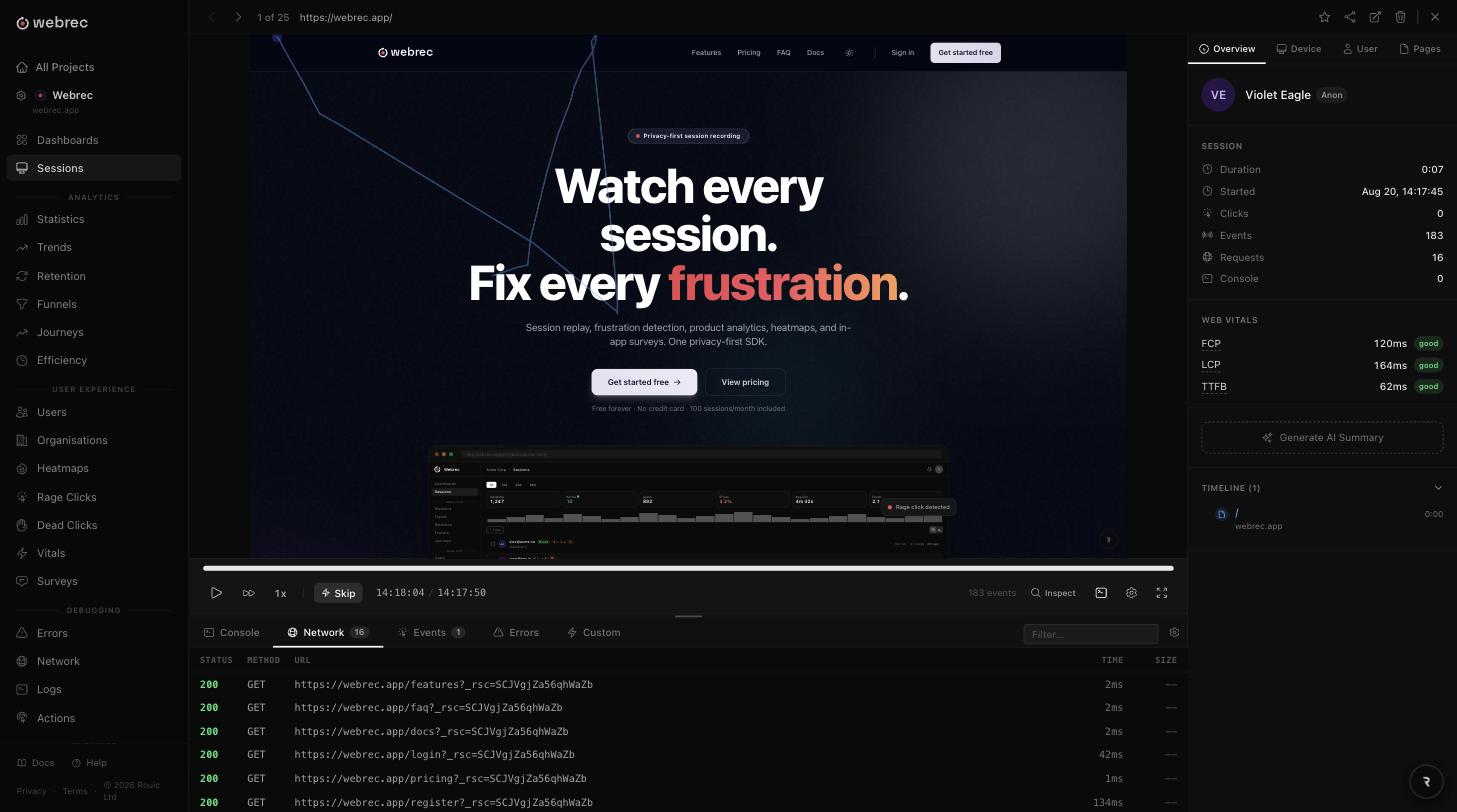
Click any occurrence and the player opens at that timestamp. The error is marked on the timeline, so you can scrub backwards through the ten seconds that led to it as easily as you can watch what happened afterwards.
The console inspector
Everything the page logged, in order, with timestamps that line up with the playhead. Scrub the replay and the console scrolls with it. Most of the time the real cause is a warning your own code printed a few seconds earlier, which no stack trace would ever have shown you.
The network inspector
A waterfall of every fetch and XHR call with status codes, timings, and failed requests highlighted. When a component throws on a null field, the response body that was missing that field is usually sitting a few rows above the error.
Inspect mode
Pause the replay and click an element to read its tag, classes, selector, data attributes as they were at that instant. Useful when the bug is a rendering problem rather than a thrown exception, and the screenshot in the bug report shows a layout you cannot reproduce locally.
Error clicks
An error click is a JavaScript error thrown within one second of a click. It separates the errors a user actually walked into from the ones that fire in the background and hurt nobody. Error clicks feed the same frustration score as rage clicks and dead clicks, so noisy pages surface on their own.
The frustration signals are worth reading together with your error list. A page with a high error count and no error clicks is leaking exceptions somewhere harmless. A page with few errors and a wall of rage clicks is broken in a way JavaScript never noticed. Both are covered on the frustration detection page.
From error to ticket without retyping anything
Alerts and webhooks cover the part where somebody needs to know. Set a condition on error spikes, new errors, rage-click spikes, or slow Web Vitals, and route the notification to Slack, email, or a webhook you handle yourself. The webhook payload is plain JSON, so pointing it at an internal service or a chat bot takes minutes rather than a project.
When it is time to file the work, create a Jira or Linear issue straight from the session. The issue is created with the title and description you type and a link back to the recording, so whoever picks it up starts by watching the failure rather than asking for reproduction steps in a thread. Connect the integration once in project settings and it is available from every session afterwards.
Errors are one signal among several. The same sessions feed heatmaps, funnels, retention, and Web Vitals, which cover LCP, FCP, CLS, INP, and TTFB. The features overview lists the lot, and the documentation covers configuration and the SDK API in detail.
Error data and privacy
Debugging a production error means looking at a real person’s screen, so the defaults are set conservatively. Form inputs are masked by default and password fields are always masked, whatever your configuration says. Sensitive query parameters, including token, key, password, secret, auth, access_token, api_key, jwt, and session_token, are stripped out of captured URLs before anything leaves the browser. Request and response bodies are only captured under 16 KB.
Anything you never want recorded can be excluded entirely with the wr-block class or a CSS selector, and blocked regions appear as a placeholder in the replay. Do Not Track and Global Privacy Control are respected, so a visitor who has asked not to be recorded is not recorded.
Everything runs on Webrec’s own UK infrastructure, operated by Rouic Ltd. Session data, error data, and uploaded source maps stay in the UK. There is no third-party analytics vendor sitting behind the product and no data sold onwards. The FAQ and privacy policy go into the specifics.
What it costs to run
Error tracking is not a paid add-on. The free plan gives you 100 sessions a month with every feature and no credit card. Paid plans start at $30 USD a month for Starter with 2,500 sessions, then Pro at $85 and Business at $250, each with a larger monthly error allowance and longer retention. Every plan includes unlimited team members, because deciding who is allowed to look at a production error is a strange thing to charge for. The pricing page has the full breakdown, and the comparison page sets Webrec against the alternatives.
Common questions
How is this different from a dedicated error monitoring tool?
Most error tools give you a stack trace, a browser string, and a breadcrumb trail you have to imagine your way through. Webrec gives you the recording. You watch the user reach the broken state, see what they typed, what the page rendered, what the API returned, and what the console said, then read the stack trace with all of that context already on screen. Reproduction steps stop being guesswork.
How are errors grouped?
By error type plus a fingerprint of the stack trace. The same TypeError thrown from the same place collapses into one group no matter how many users hit it, and the group tracks first occurrence, last occurrence, total count, and affected sessions. You can filter by type, message, URL, date range, and occurrence count to separate a one-off from a regression.
What is an error click?
An error click is a JavaScript error thrown within one second of a click. It is one of three frustration signals Webrec detects, alongside rage clicks (3 or more clicks within 30px of each other in under 800ms) and dead clicks (no DOM change, navigation, or network request within 2 seconds). Error clicks tell you the error was not background noise: a user pressed something and it broke.
Do I need source maps?
Not to capture errors, only to read them comfortably. Without source maps you get the minified file, line, and column, which is enough to group and count but painful to debug. Upload your source maps from your build pipeline through the source map API and the stack trace resolves to your original files. The maps are stored privately and are never served to the browser.
Does error tracking slow the page down?
The SDK is roughly 50KB gzipped and stays under 1% CPU overhead. Error capture is a pair of passive listeners; console and network capture are thin wrappers that pass the call straight through. Events batch and flush on an interval rather than firing a request per error, so an error storm does not turn into a network storm.
Can I keep the error tool I already use?
Yes. Plenty of teams run a dedicated error service for alerting and use Webrec for the replay behind each error. Log the result of WebRec.getSessionUrl() as context on your existing reports and every issue in that tool carries a direct link to the recording. The two happily coexist.
More answers on the FAQ page, or read about product analytics and heatmaps.
Watch your next error happen
Add the SDK, wait for something to break, then press play. Start with 100 free sessions a month. No credit card, no sales call.