Heatmaps
Click heatmaps built from real sessions
Most heatmap tools crawl your page to make the background image. Webrec renders it from an actual session replay instead, so pages behind a login look exactly as your users saw them, with inputs masked. Click density, scroll reach, and the elements people really clicked, per device.
Why the background image matters
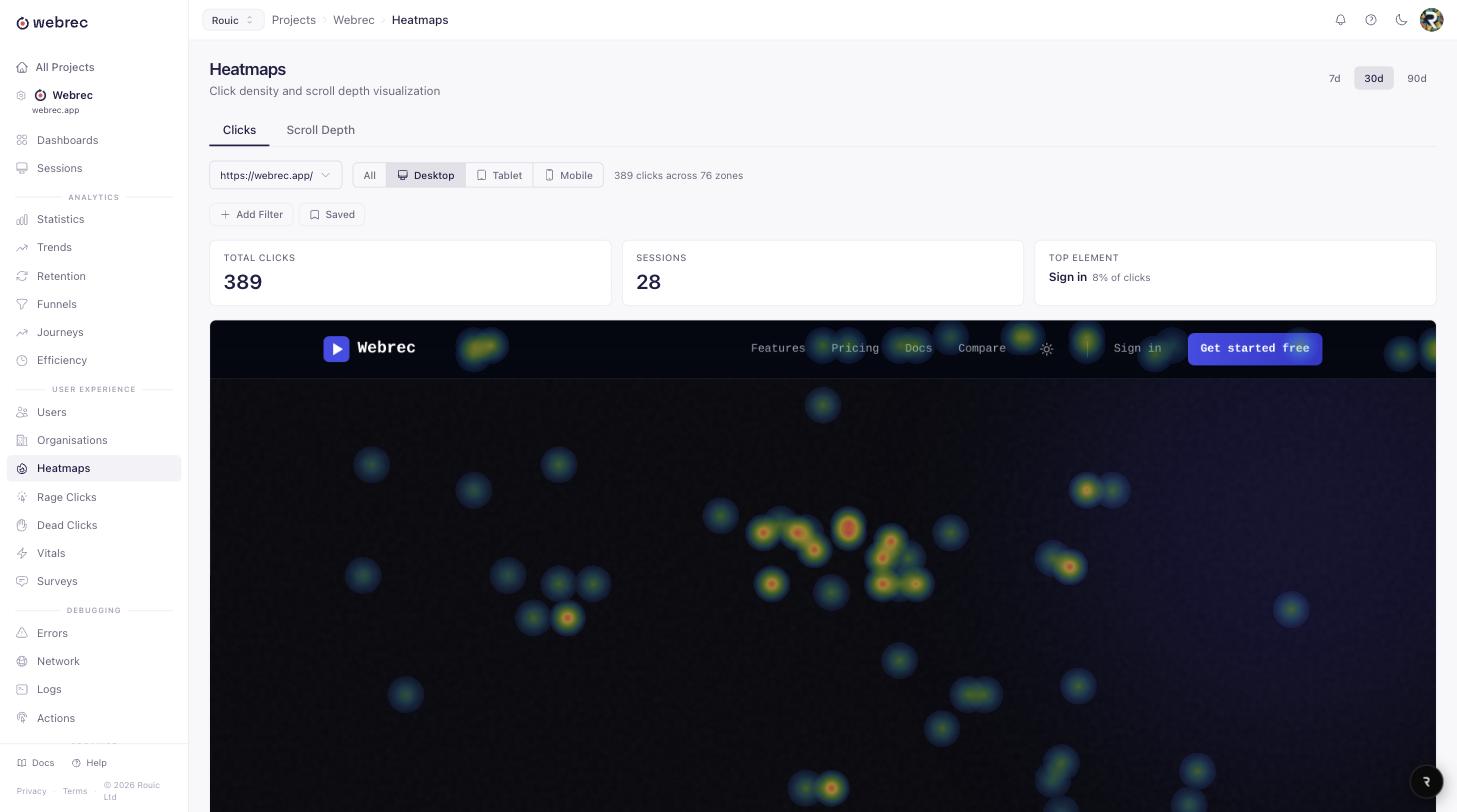
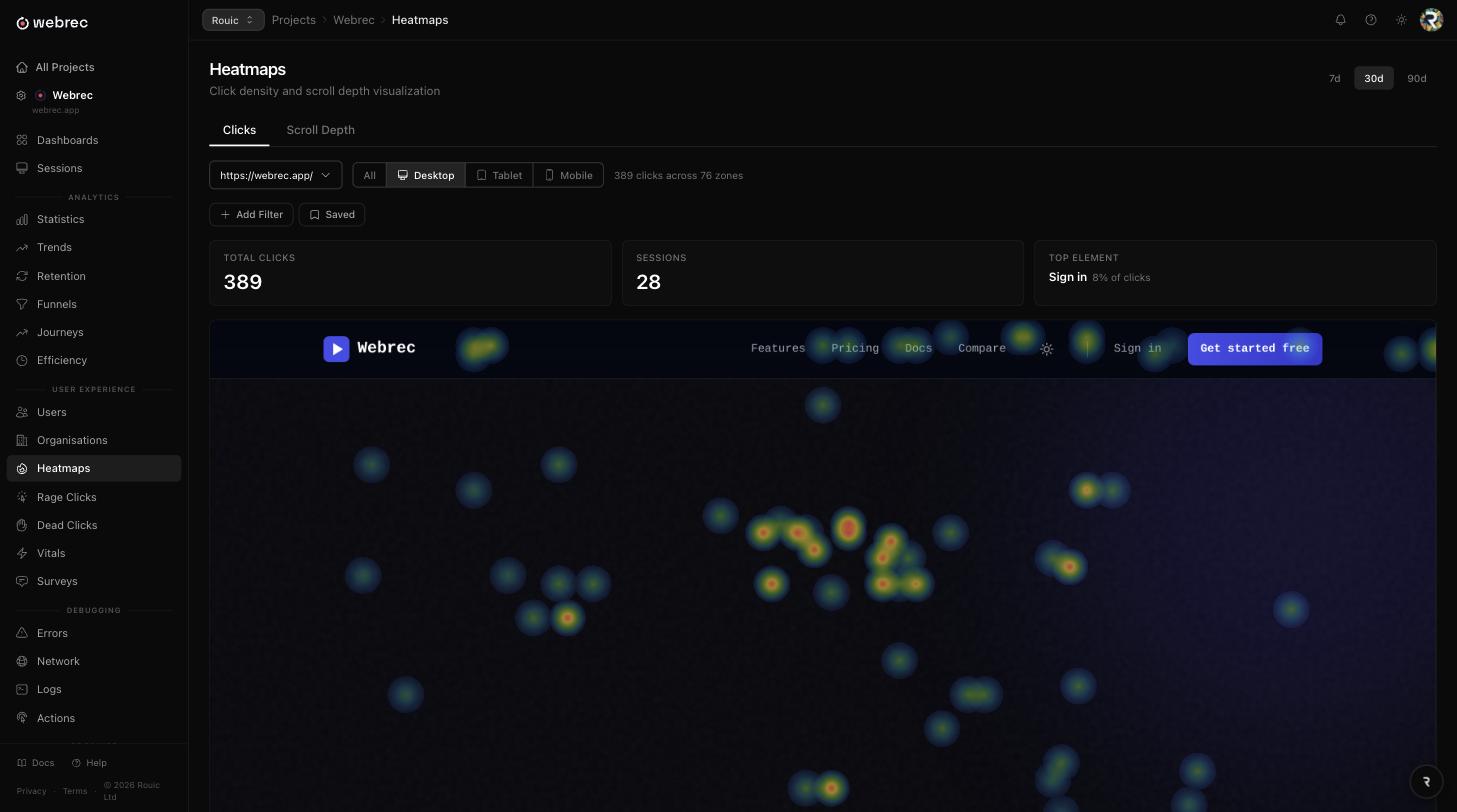
A heatmap is two things stacked on top of each other: a picture of the page, and a layer of dots showing where people clicked. The dots are the easy part. The picture is where most tools quietly fall over.
If the picture comes from a crawler visiting the URL, anything the crawler cannot reach is wrong. Your signed-in dashboard becomes a screenshot of the login form. Your checkout becomes an empty basket. Personalised content shows the default variant.
Webrec takes the picture from a session that actually happened. A background job selects recorded sessions for the page, replays them in a headless browser, seeks to the moment that page was on screen, measures the true content height by walking element bounds rather than trusting scrollHeight, and captures at twice device scale so it stays sharp. Snapshots refresh weekly, so the underlay tracks your page as it changes.
The privacy properties come along for free. The replay was already masked when it was recorded, so the screenshot cannot contain anything the recording did not, and no crawler ever needs credentials.
What the heatmap view gives you
Six things, each of which exists because a real page was hard to read without it.
Click density maps
Every click is aggregated into a 10px grid and drawn as a density layer over the page. The layer counts clicks rather than people, and the session total for the page is shown alongside it, so you can see whether a hotspot came from many visitors or from one person clicking repeatedly.
Scroll reach
Scroll depth is bucketed in 10% steps and shown as reach: the share of sessions that got at least that far down the page. It is the number a scroll map is actually about, and it makes the drop-off between your headline and your pricing table obvious.
Top clicked elements
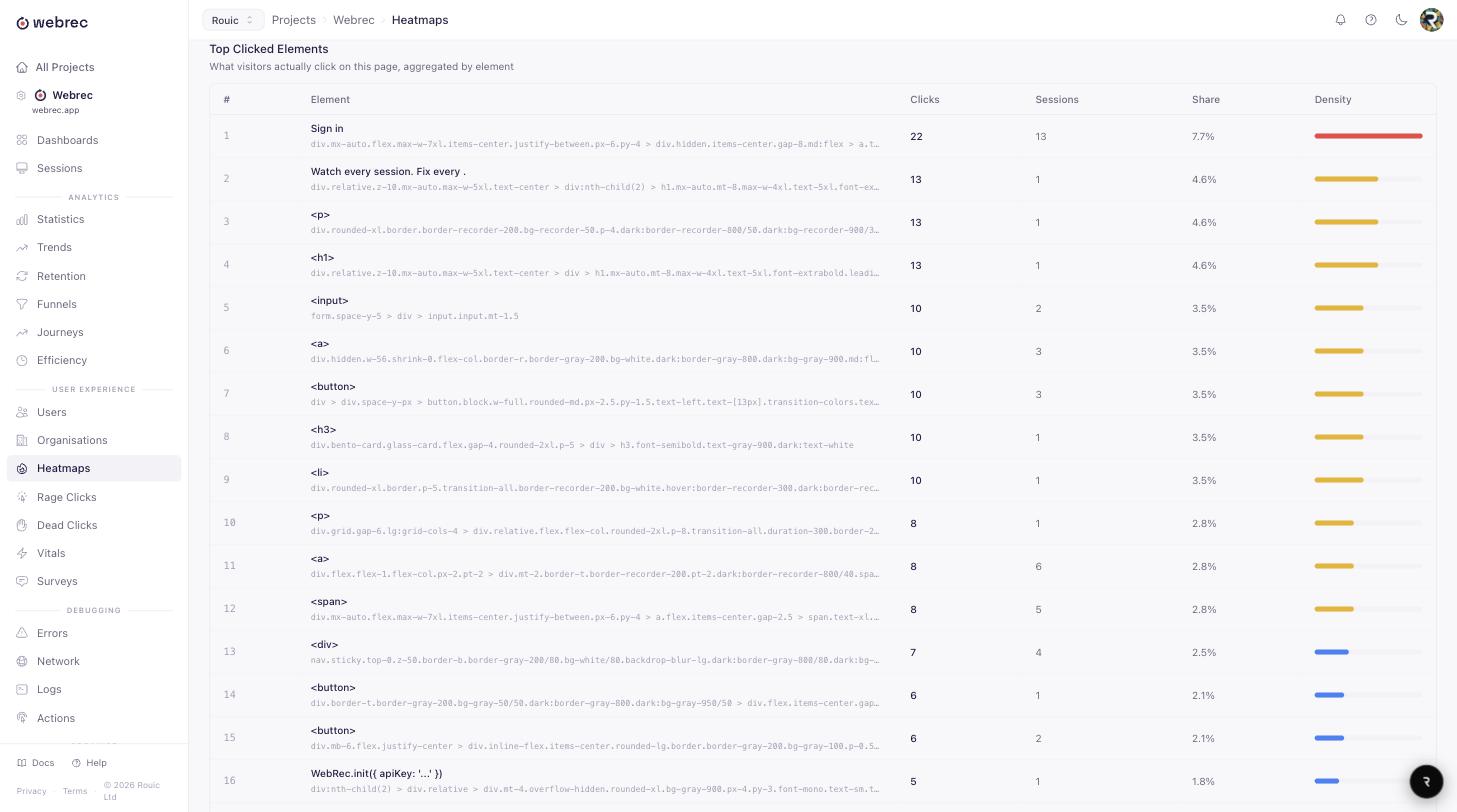
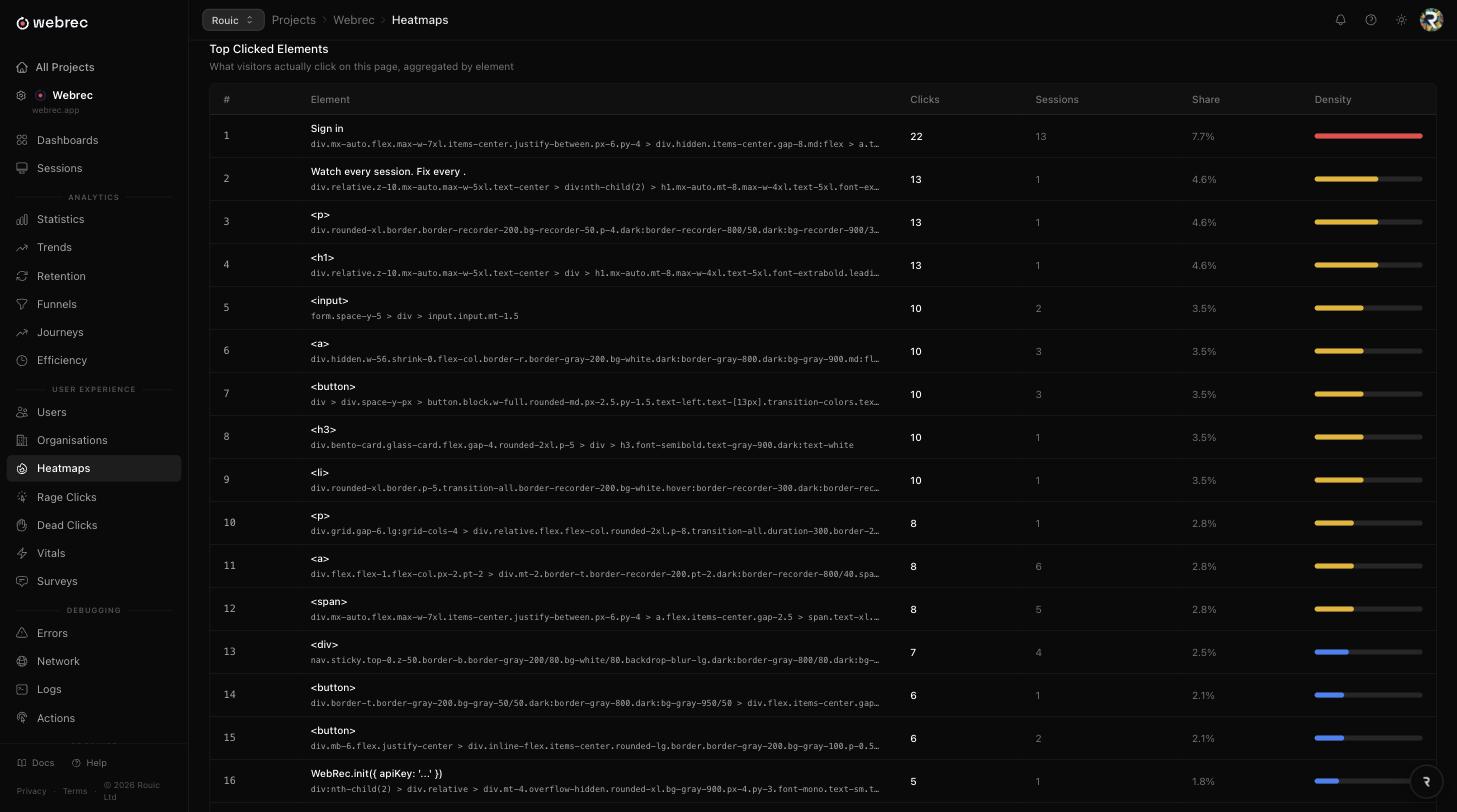
Underneath the map is a table of the elements people actually clicked, by CSS selector, tag, link target, and visible text. It turns "148 clicks around (715, 2340)" into "Start free trial: 148 clicks across 96 sessions".
Per-device views
Mobile, tablet, and desktop each get their own map and their own underlay, because a three-column layout on desktop is a stack on a phone. Coordinates are normalised so a 1280px laptop and a 2560px monitor line up instead of smearing into two ghost pages.
URL pattern grouping
Pages are grouped by pattern, so /orders/123 and /orders/456 are one page called /orders/:id rather than thousands of pages with one click each. Without this, heatmaps are useless on anything with an ID in the path.
Date ranges and filters
Pick a window up to 90 days and narrow by browser, operating system, country, session length, or whether the visitor was identified. Compare the week you shipped a redesign against the week before it.
How the numbers are worked out
Coordinate normalisation. Raw click coordinates are meaningless across monitor sizes: a button 80% of the way across the page lands at x=1024 on one screen and x=2048 on another. Every click is rescaled to a canonical width for its device bucket, 390px for mobile, 834px for tablet, 1440px for desktop, before it is added to the grid. The combined view rescales mobile and tablet cells into desktop space by relative position, so you can look at one map or three.
Device buckets. A viewport under 768px is mobile, under 1024px is tablet, anything wider is desktop. The underlay renderer is stricter: it will only use a session between 320px and 480px wide as a mobile background, because a 601px desktop window classifies as mobile but makes a terrible mobile screenshot.
Scroll reach. Each session contributes its deepest scroll position as a percentage. Those are grouped into 10% buckets, and the map shows the cumulative share of sessions that reached each band. A page where reach falls from 90% to 30% between the first and second screen tells you where to move your call to action.
Page grouping. Clicks are stored against a normalised URL pattern with IDs and slugs collapsed to :id, so a per-record page is one entry in the page list. Density is served from a rollup that is refreshed on a schedule, which is why the default views load quickly.
The honest caveat. The rollup only covers project, page, device, and date. Apply a session-level filter, say Safari users in Germany with sessions over two minutes, and the query falls back to scanning raw click rows. On most projects that is fine. On a page with millions of clicks it is noticeably slower, and the element table has a ten second execution limit after which it returns empty rather than hanging. If you filter hard on a busy page and get less than you expected, narrowing the date range usually fixes it.
Heatmaps are the map, replays are the territory
A heatmap tells you that 40% of clicks on your pricing page land on a heading that is not a link. It does not tell you what the person was trying to do. That is what session replay is for, and both come from the same recording, so there is nothing extra to install and nothing to reconcile between two products.
The same click stream feeds frustration detection. A rage click is 3 or more clicks within 30px of each other in under 800ms. A dead click is a click with no DOM change, navigation, or network request within 2 seconds. An error click is one followed by a JavaScript error within 1 second. When a hotspot on your heatmap is mostly dead clicks, you have found something that looks clickable and is not.
Web Vitals are captured on the same pages, LCP, FCP, CLS, INP, and TTFB, so a section nobody scrolls to can be checked against how long it took to render. The features page covers the rest, and the comparison page sets it against Hotjar, FullStory, and LogRocket.
Where the data lives
Webrec runs on its own UK infrastructure, operated by Rouic Ltd. Session data stays in the UK, including the click and scroll records behind every heatmap and the rendered underlay images. There is no third-party analytics vendor in the middle of it.
Inputs are masked by default rather than as an opt-in setting, so the first recording you take is already masked and so is the first heatmap underlay generated from it. Do Not Track and Global Privacy Control are respected: visitors signalling either are not recorded, so they contribute no clicks and no scroll data.
Heatmap questions
How is the page underlay generated?
A background job picks real recorded sessions for the page, replays them in a headless browser, and screenshots the result. Candidates are ranked by how close their viewport is to the canonical width for that device and by engagement, then rendered until one passes the quality checks. The seek point is clamped inside the visit, so a quick navigation cannot put the next page in the picture.
Will it work on pages behind a login?
Yes, and that is the main reason the underlay comes from replays rather than a crawler. A crawler hitting your dashboard URL gets a login screen; a replay of a signed-in session shows the page as that person saw it. Checkout steps, admin screens, and anything gated work the same way.
Are form inputs visible in the screenshot?
No. The screenshot inherits the recording, and inputs are masked by default, so what was masked during capture stays masked in the underlay. Do Not Track and Global Privacy Control are respected, so visitors who signal opt-out are never recorded and never appear in a heatmap.
How many clicks do I need before a heatmap is useful?
A few hundred clicks on a page is usually enough to see structure. Below that the density layer is honest but sparse, and the top clicked elements table is more informative than the map. The free plan covers 100 sessions a month, which is enough to check that the pipeline is working on your own pages.
Why do heavily filtered heatmaps take longer?
Click density is served from a pre-aggregated rollup keyed by project, page pattern, and device, which is what makes the common views fast. Session-level filters cannot be answered from that rollup, so the query falls back to scanning raw click rows. On a very busy page that is slower, and on the busiest it can time out and return an empty result rather than hang.
Do heatmaps slow my site down?
The SDK is 50KB gzipped and stays under 1% CPU overhead. Clicks and scroll depth come from the same recording stream as session replay, so heatmaps add no extra script, no extra request per page, and no separate tag to install.
More answers are on the FAQ, the install steps are in the docs, and every plan, including the free one, includes heatmaps and unlimited team members. See pricing for the session limits.
See your own pages
Drop in the SDK and the first heatmaps appear as sessions arrive. Start with 100 free sessions a month. No credit card, no sales call.