Frustration detection
Rage clicks, dead clicks, and the bugs hiding behind them
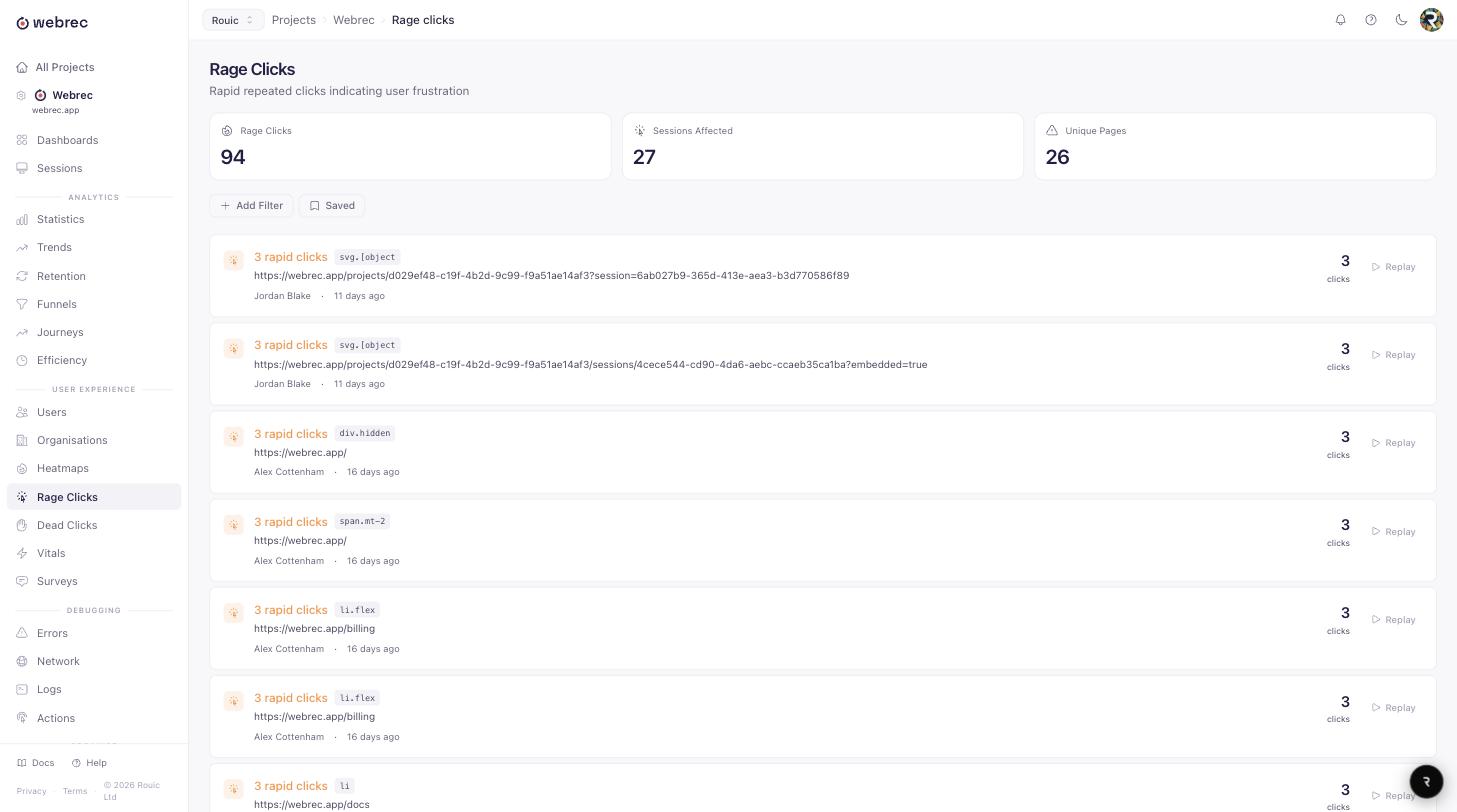
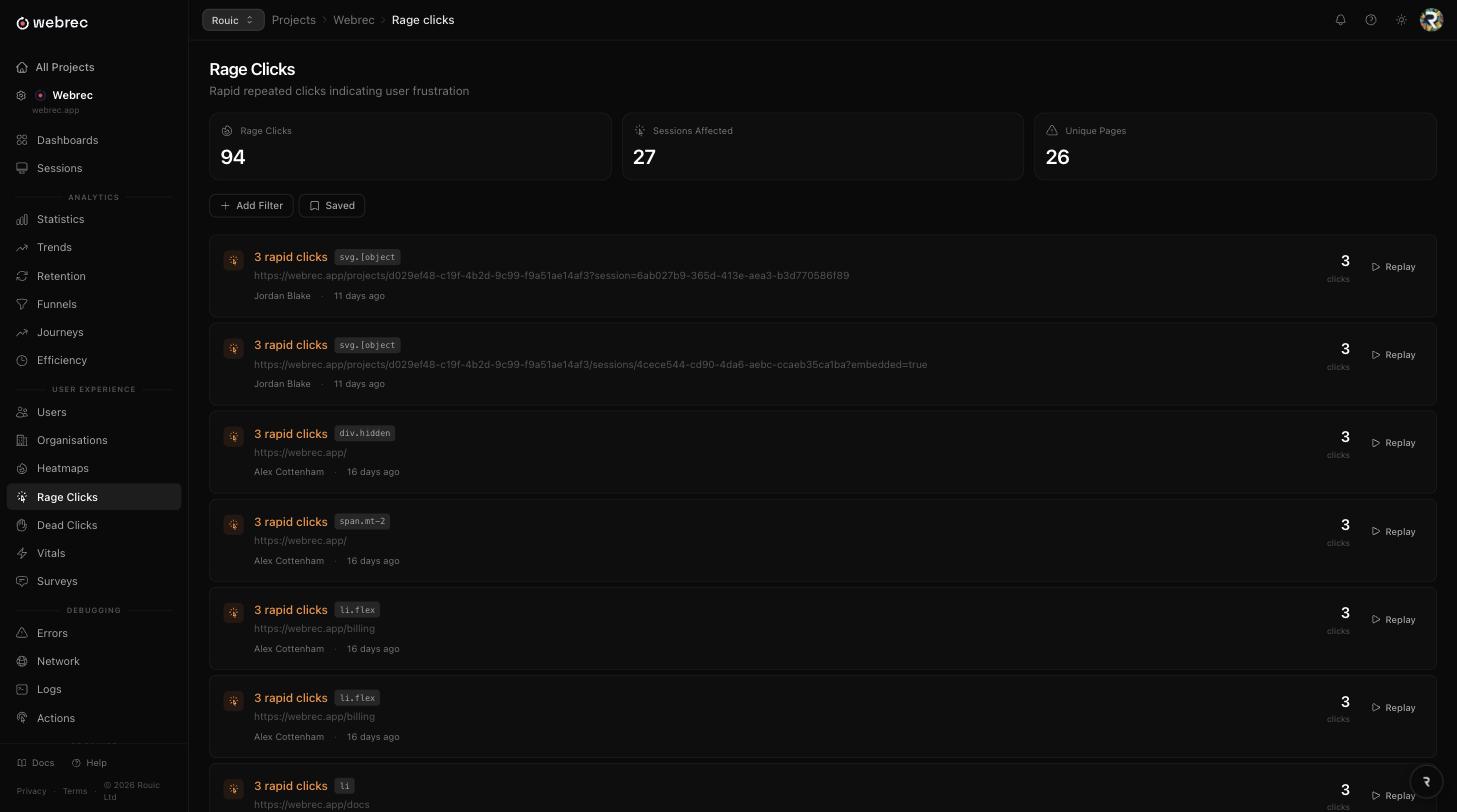
Webrec flags three user frustration signals while it records: rage clicks, dead clicks, and error clicks. Each has a precise threshold you can check, so a spike points at a specific element on a specific page instead of a general sense that something is off.
How each signal is defined
Most tools describe frustration in adjectives. Here are the actual rules, so you can reason about what will and will not be flagged before you install anything.
Rage click
3+ clicks within 30px of each other in under 800ms
The radius matters more than the count. Someone working quickly through a list of checkboxes moves the pointer between targets, so those clicks spread out and are ignored. A rage click is the same spot, hit again and again, because the first click appeared to do nothing.
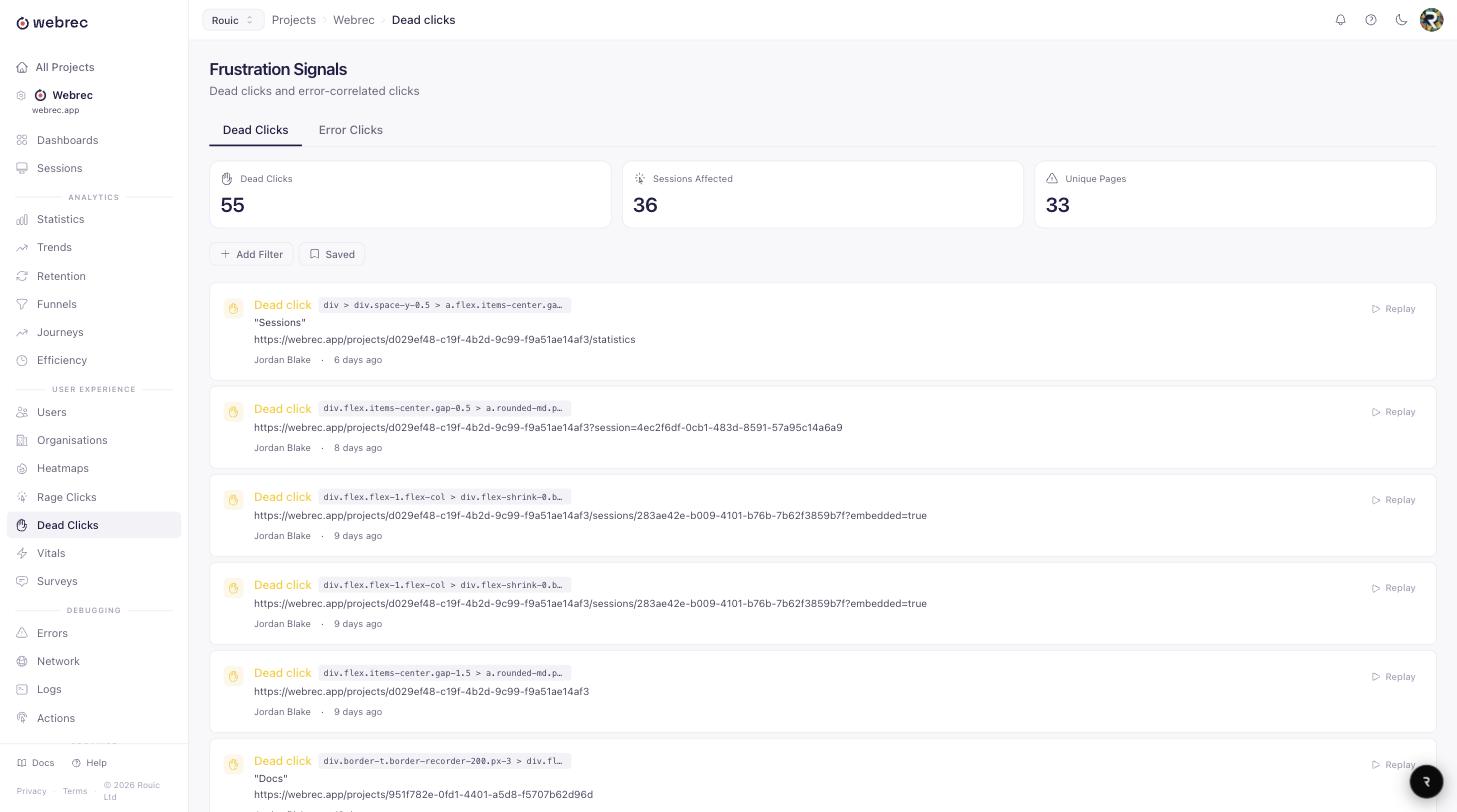
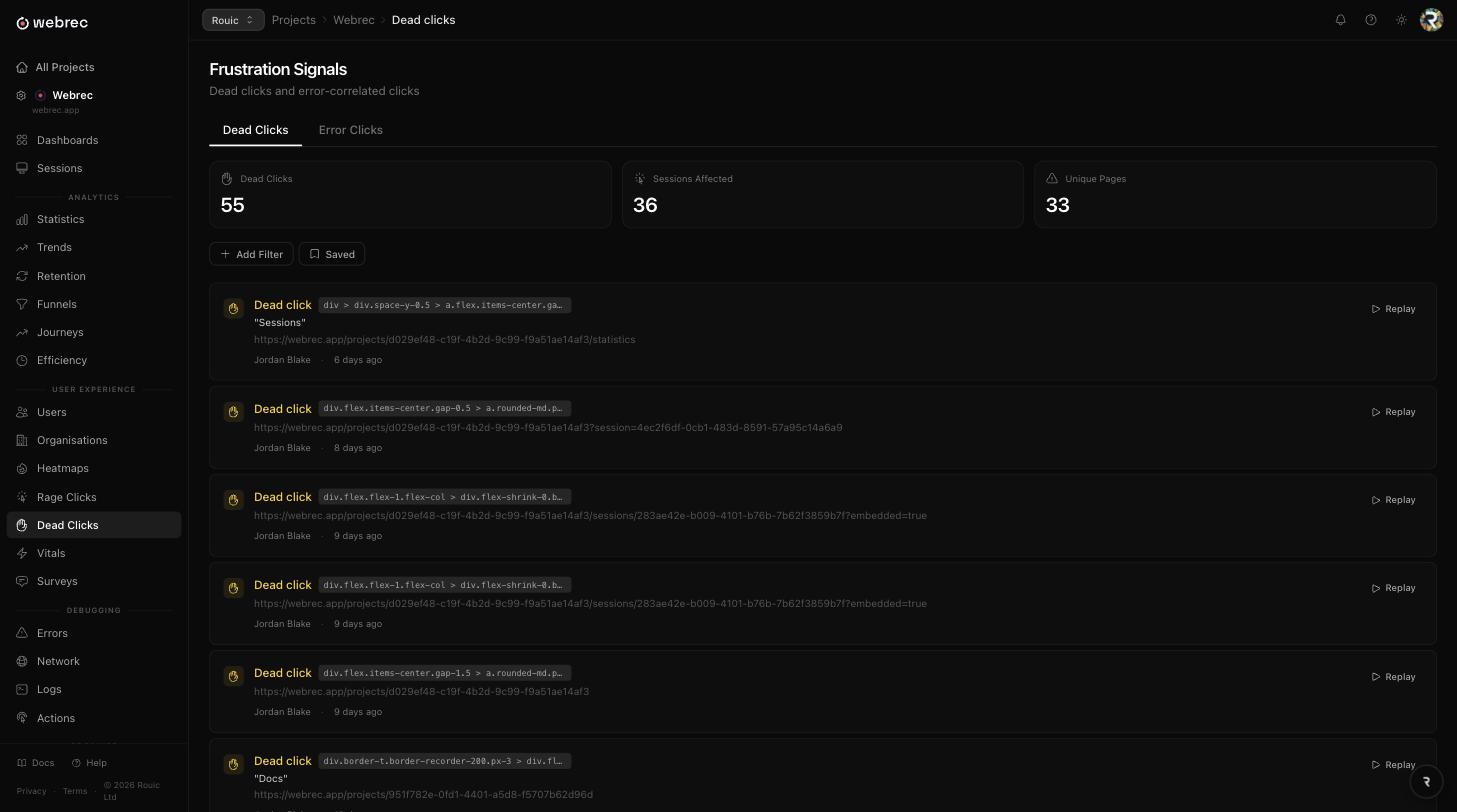
Dead click
No DOM change, navigation, or network request within 2 seconds
Webrec already watches DOM mutations, history changes, and fetch or XHR traffic in order to build the replay. A dead click is a click where all three stayed silent for two full seconds. Nothing rendered, nothing routed, nothing was requested.
Error click
A JavaScript error within 1 second of a click
Uncaught errors and unhandled promise rejections are already captured. An error click links one to the interaction immediately before it, which turns a stack trace with no context into a specific button on a specific page.
A dead click is usually your bug, not their mistake
The instinct when you first see a dead click report is to assume people are clicking on things that were never meant to be clickable. Occasionally that is true, and it tells you something useful about your visual hierarchy. Far more often the element was genuinely interactive and it genuinely failed.
A handler throws on the first line and never reaches the state update. A listener is bound during hydration to a node that React has since replaced. A form submit hits a validation branch that returns early without rendering a message. From the browser side these are three different defects. From the user side they are one experience: nothing happened, so click it again, which is how a dead click becomes a rage click a few hundred milliseconds later.
That two second window is the part worth understanding. A slow API call that returns after 1.5 seconds still counts as a response, because the request itself is a network event the moment it is sent. What gets flagged is silence: no mutation, no route change, no request at all. If you also want to know whether the click threw, the error tracking side of the same recording answers that with the stack trace attached.
The composite frustration score
Individual signals are useful for finding broken elements. For deciding which session to watch next, every session also carries one number. It is a weighted total of rage clicks and error clicks (three points each), dead clicks (two points each), and uncaught errors (one point each), so it has no upper bound: a badly broken session simply scores higher.
0
None
No frustration signals in the session.
1 to 4
Low
Minor friction. Worth watching, rarely worth a ticket.
5 to 9
Medium
Noticeable frustration. This is the band most review queues start at.
10+
High
Repeated signals, usually a defect on a specific element.
One caveat we would rather state up front: the score is not normalised by session length. A forty minute session accumulates more of everything than a thirty second one, so a high score on a long session sometimes just means a long session. Use it to order your review queue, not as a metric to report to anyone.
From a signal to a shipped fix
Detection on its own just produces a longer list of things to worry about. The point is the route from a flagged click to the line of code responsible.
01
Sort the queue by frustration
The session list sorts by frustration score as well as recency, and filters on rage click count and whether a session has errors. Sorting by score turns thousands of sessions into a shortlist you can actually watch, worst first.
02
Jump to the moment, not the session
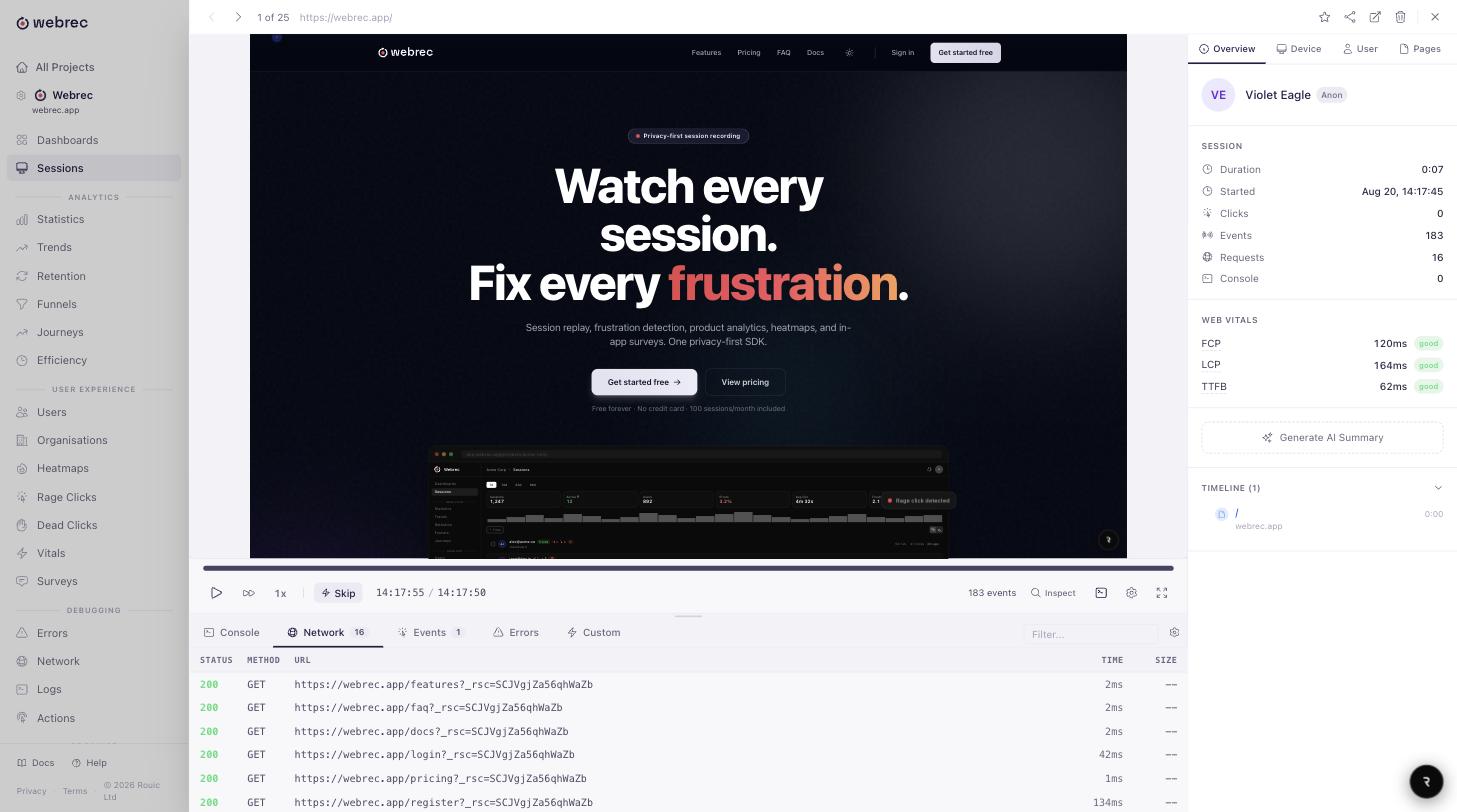
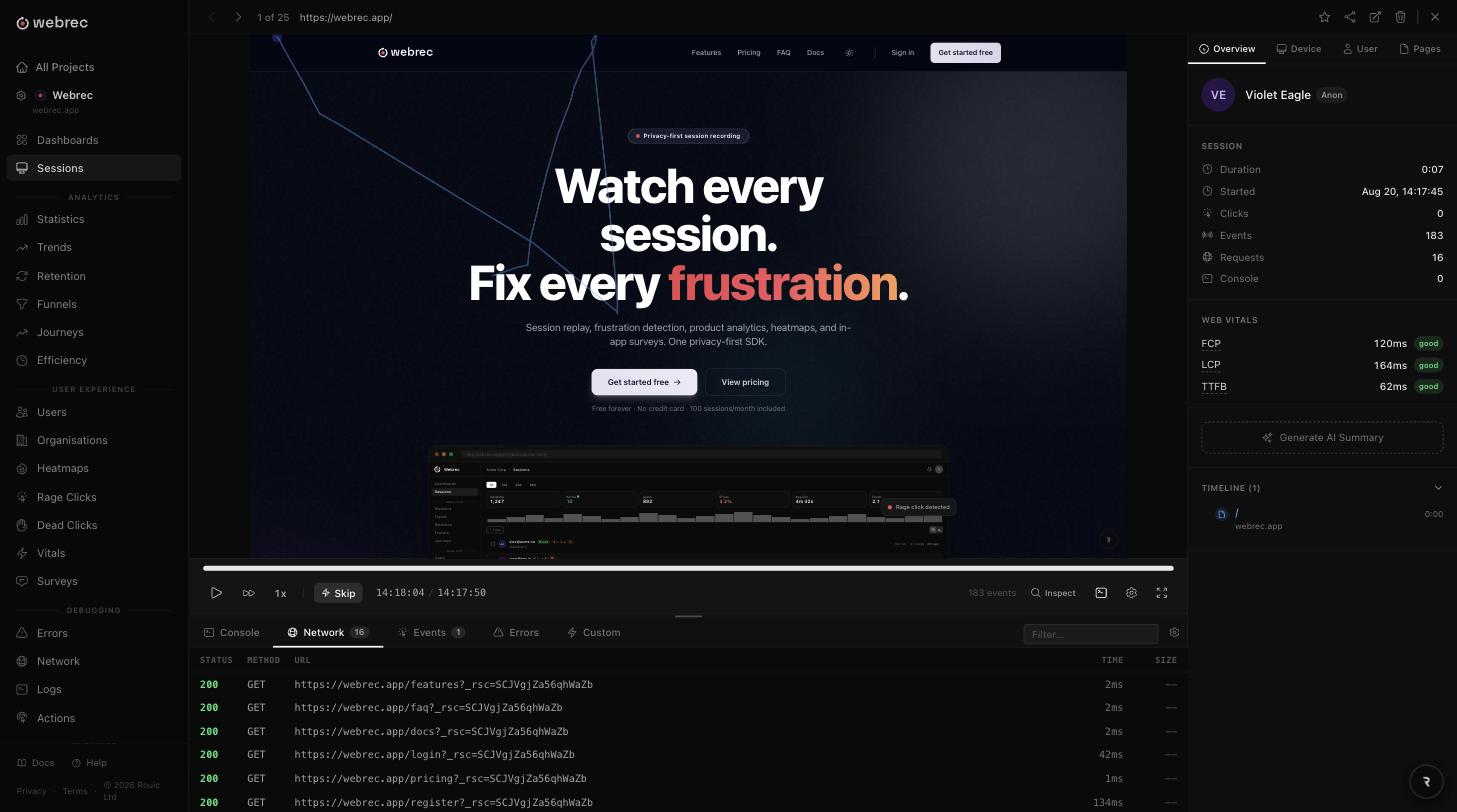
The replay timeline marks rage clicks, errors, and page navigations, so you can jump to the second the signal fired instead of scrubbing. The DevTools panel next to the player shows the console output, network requests, and errors from that same moment.
03
Find the element by selector
Every rage click and dead click is stored with its CSS selector and page URL, and rage clicks also carry how many clicks fired. Both lists filter on selector and URL, which is how you tell a one-off from a pattern: forty rage clicks across thirty sessions, all on the same selector, is a bug report that writes itself.
04
Confirm the fix
Each list shows totals, sessions affected, and unique pages for the period. After you ship, the same filter on the same selector should trend towards zero. If it does not, the handler is still failing for some subset of browsers.
Step two is the one that changes how a team works. Session replay turns a count into evidence, and heatmaps tell you whether the failing element is one people actually reach. The full list of what the recorder captures is on the features page.
What frustration detection records about people
Less than you might assume. A flagged click stores where on the page it landed, the element selector, the URL, and the timing. It does not need to know what anyone typed. Form inputs are masked by default, password fields are always masked, and sensitive query parameters are stripped from captured URLs before anything is stored. Do Not Track and Global Privacy Control are respected.
Recordings run on Webrec’s own UK infrastructure, operated by Rouic Ltd. Session data stays in the UK rather than being handed to a third-party cloud in another jurisdiction, which is usually the first question that comes back from a legal review. The documentation covers masking classes, blocked selectors, and consent patterns in detail.
Frequently asked questions
What exactly counts as a rage click?
Three or more clicks landing within 30px of each other, horizontally and vertically, in under 800 milliseconds. Both parts have to hold. Fast clicking that moves across the page is not counted, and three slow clicks on the same button over five seconds are not counted either. The rule is deliberately tight so the signal stays worth acting on.
Is a dead click always a bug?
Not always, but far more often than teams expect. The usual causes are a handler that threw before it updated state, a listener bound to an element replaced during hydration, or a submit swallowed by a validation branch that never rendered a message. The honest exception is an interaction handled purely in CSS with no class or attribute change, which can register as dead even though it worked. Watch one replay before filing anything.
How is the frustration score calculated?
It is a weighted total with no upper bound: three points for each rage click and each error click, two for each dead click, and one for each uncaught error. Treat it as a priority order for your review queue rather than a metric to report: a forty minute session naturally accumulates more of everything than a thirty second one.
Do I need to add any code to turn this on?
No. Detection runs from the same recording the SDK already sends, so installing the snippet is the whole setup. There are no events to instrument and no selectors to register in advance. Signals appear on sessions recorded from that point on, usually within seconds of the session arriving.
Does it work in a single-page app?
Yes. Route changes through pushState, replaceState, popstate, and hashchange are detected automatically, which matters here because navigation is one of the three things a dead click checks for. A client-side route change counts as a response, so an SPA link that routes correctly is never flagged.
Can I be told when rage clicks spike?
Alerts and webhooks are included on every plan, including the free one, alongside the Jira, Linear, and Slack integrations. Route notable session events to a team channel and a new frustration pattern reaches you without anyone opening the dashboard.
Every feature is on every plan, including the free one: 100 sessions a month, no credit card. Paid plans start at $30 USD a month for 2,500 sessions and every plan includes unlimited team members. See pricing for the full breakdown, or the general FAQ for questions about the platform as a whole.
Find out what your users are clicking twice
Install the SDK and the first rage clicks usually show up the same day. Start with 100 free sessions a month. No credit card, no sales call.