Product analytics
Product analytics with the replay attached
A chart can tell you how many people dropped between the pricing page and the checkout. It rarely tells you why. Webrec puts funnel analysis, retention cohorts, user journeys, and trends next to the session recordings, so any number you can point at has a set of watchable examples behind it.
100 sessions a month on the free plan, every feature included, no credit card.
What you get
Six analysis surfaces, all reading from the same recorded sessions. There is no separate analytics pipeline to configure and no second SDK to install.
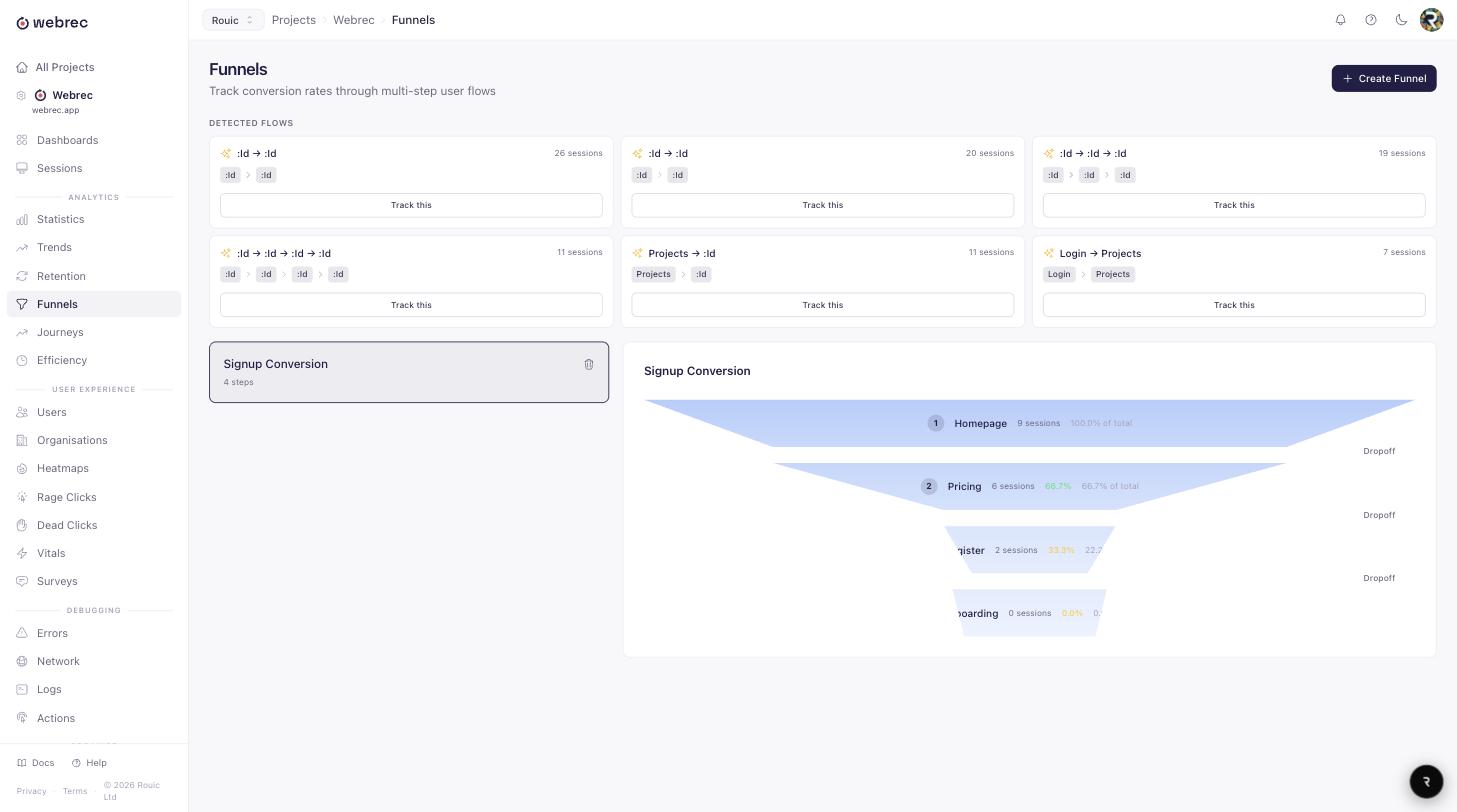
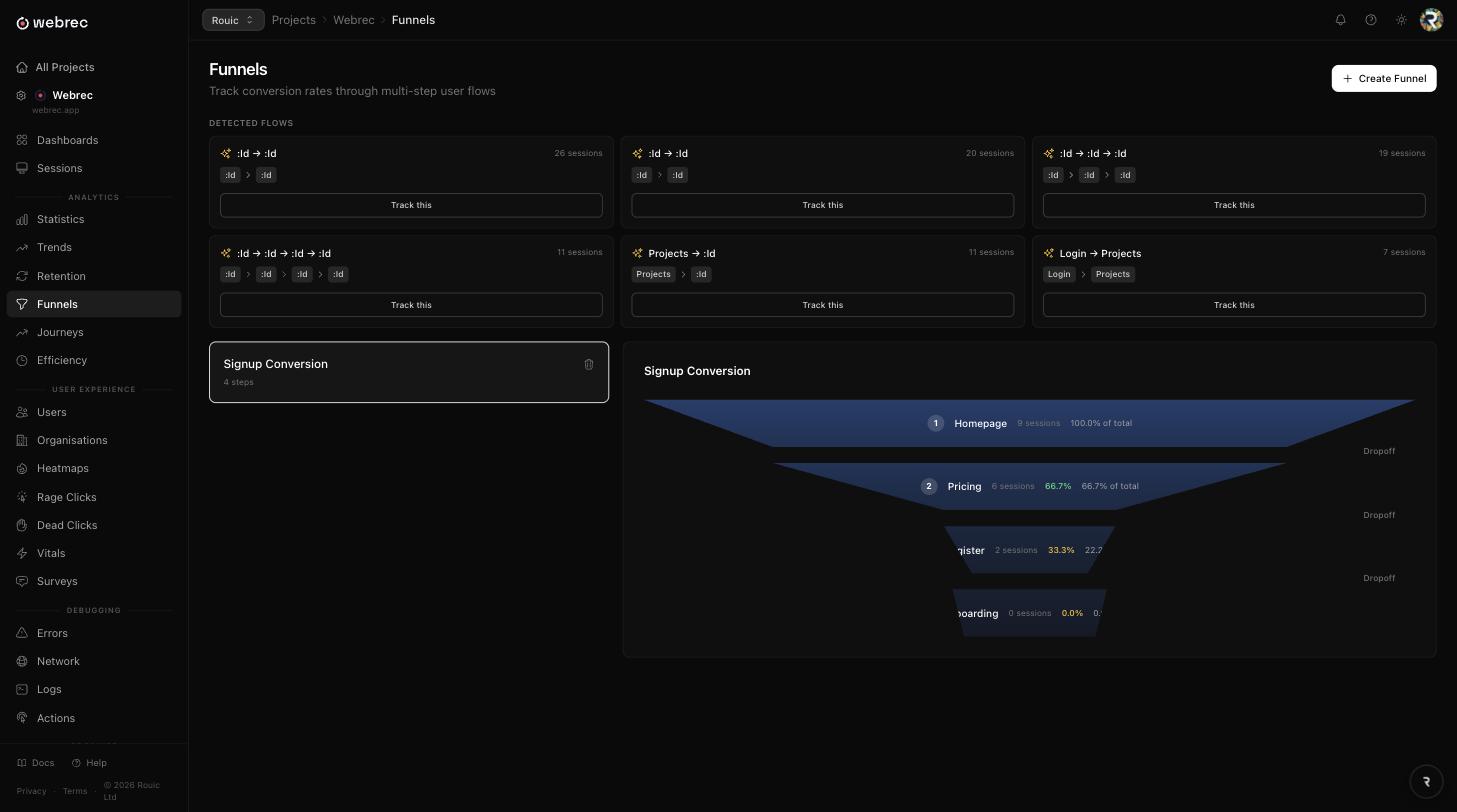
Funnels with watchable drop-off
Build a funnel from page URLs, detected actions, or a mix of both. Each step reports its conversion rate, the number of people who dropped, and the median time users took to reach the next step.
Click a step to open the sessions that reached it, or the sessions that stopped there. A drop-off percentage is a number. Watching six of those people hunt for a button that sits below the fold is a fix.
Retention cohorts
Group users by the day, week, or month they first appeared, then see what share came back in each period after. The result is a heatmap, colour-coded by retention percentage.
Retention needs identified users, so call WebRec.identify() at login. Cohorts built on anonymous browser IDs fall apart the moment somebody clears storage or switches device.
User journey diagrams
A Sankey diagram of the paths people actually take, with edge thickness in proportion to traffic. Filter by time period and by start or end page to answer a specific question rather than admire a picture.
Under the diagram, a top paths table lists the most frequent multi-step routes with session counts, so you can read the exact sequence instead of squinting at a ribbon.
Trends with breakdowns
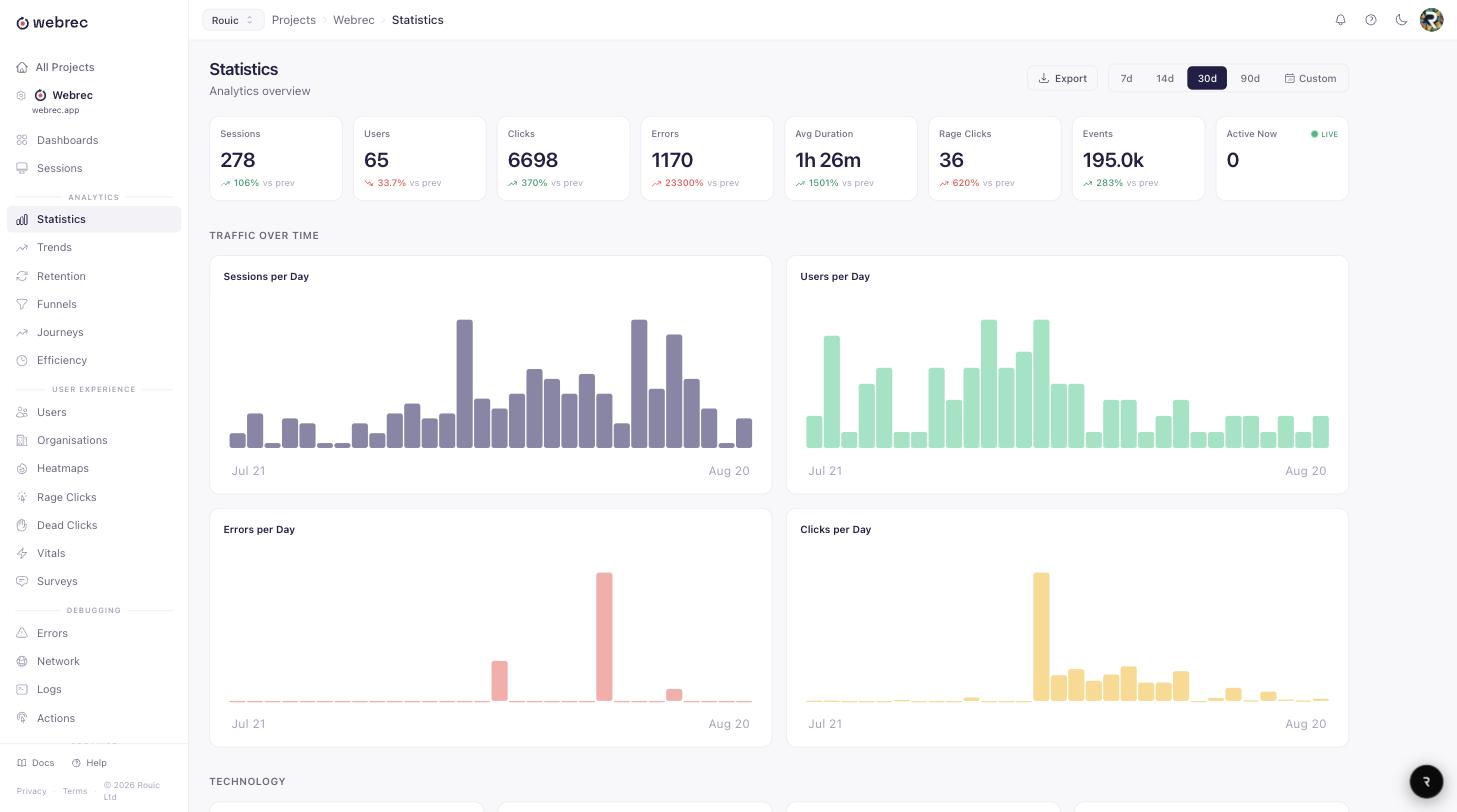
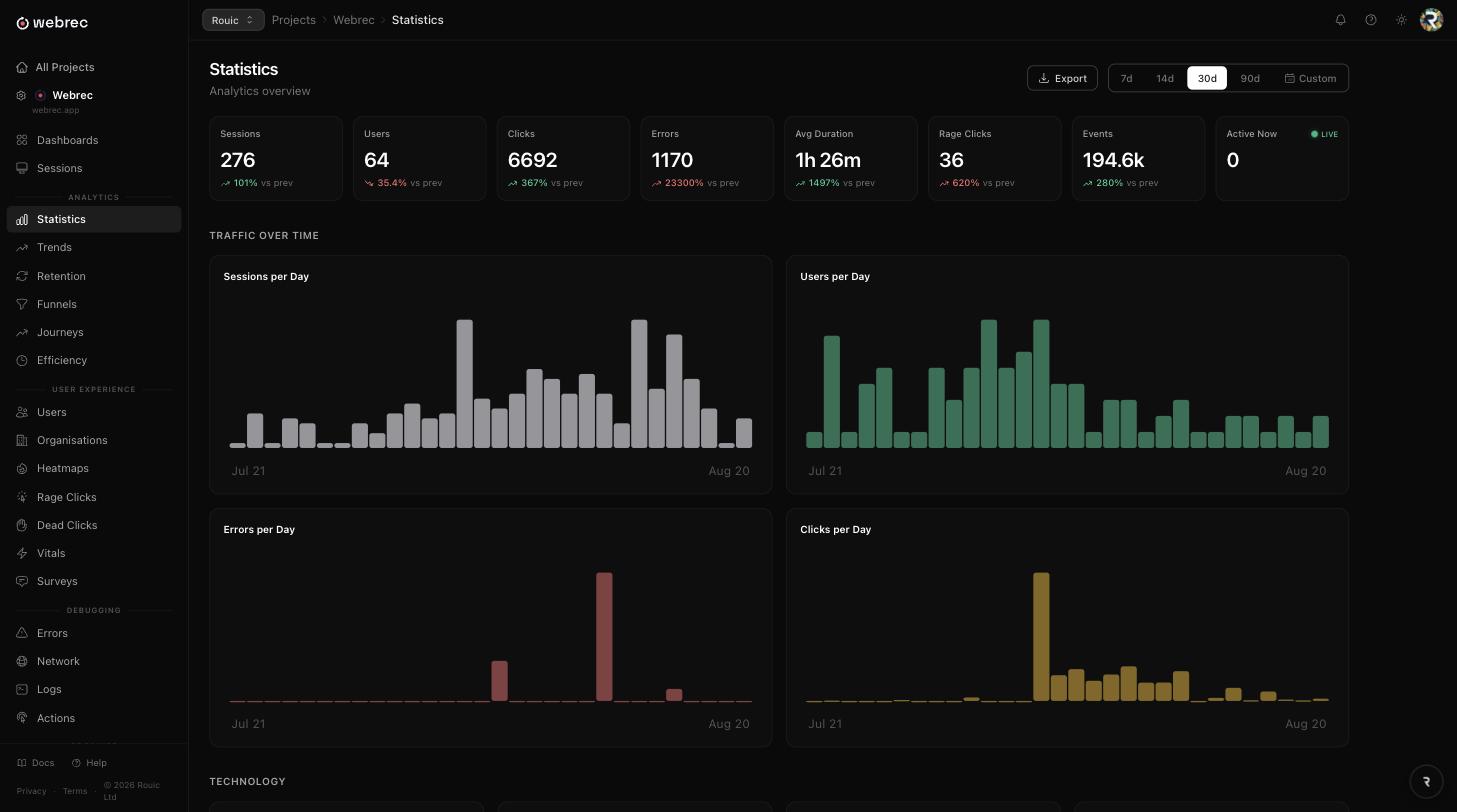
Plot sessions, users, errors, rage clicks, session duration, or page views over time, then break the series down by browser, operating system, device, country, or page.
Daily, weekly, or monthly granularity, line or stacked area charts, and CSV export. This is where a conversion dip usually turns out to be one browser version rather than the whole product.
Custom dashboards
Drag-and-drop dashboards built from eight widget types: single metric with a trend indicator, gauge, line, area, bar and pie charts, sortable table, and ranked list.
Start from a template or from nothing. Dashboards are shared with your team, and every plan includes unlimited team members, so there is no seat maths involved in letting somebody see a chart.
Custom events and identity
WebRec.track() sends a business event with any properties you like. Events are searchable, appear in the session view, and can drive dashboard widgets and alerts.
WebRec.identify() links a session to a real user and back-fills the earlier anonymous sessions from that browser. WebRec.group() attaches an organisation, with traits such as plan or MRR that stay searchable.
How the numbers are counted
Analytics tools disagree with each other because they define things differently and then keep the definitions quiet. Here are ours.
Sessions. A session is one visit, from page load until the visit ends. Client-side route changes (pushState, replaceState, popstate, hashchange) are detected automatically and stay inside the same session, so a single-page app does not report five sessions for one visit. Anything under three seconds is discarded rather than counted.
Users. Calling WebRec.identify() attaches your own user ID plus any traits you pass, and back-fills the earlier anonymous sessions from that browser so a signup does not appear as two unrelated people. Whether anonymous visitors also count towards the users figure is a per-project setting: leave it on for a marketing site, turn it off for a product where a user means an account.
Organisations. WebRec.group() associates a user with a company or workspace, with traits such as plan, MRR, or industry that stay searchable and filterable. In B2B products this is usually the unit that matters: one account struggling is worth more attention than one person.
Funnel steps. A step matches either a page URL or a detected action. Steps are ordered but not required to be consecutive, so a user who wanders off and comes back still converts. Median time between steps is reported rather than the mean, because one person who left a tab open overnight should not move your averages.
Frustration signals. A rage click is 3 or more clicks within 30px of each other in under 800ms. A dead click is a click with no DOM change, navigation, or network request within 2 seconds. An error click is a click followed by a JavaScript error within 1 second. These are available as trend metrics, so you can chart frustration against a release date. See frustration detection for the detail.
Performance is recorded alongside behaviour: LCP, FCP, CLS, INP, and TTFB are collected automatically, reported as P75 values with a rating distribution. When a funnel step starts losing people, a slow LCP on that page is often the first thing worth ruling out.
Where the data lives
Product analytics only works if you are willing to send it real user behaviour, so it is fair to ask where that behaviour ends up. Webrec runs on its own UK infrastructure, operated by Rouic Ltd. Session data stays in the UK, encrypted in transit and at rest. Billing is the only third party involved.
Form inputs are masked by default, and password fields are masked regardless of configuration. Do Not Track and Global Privacy Control are respected. Any element can be excluded entirely with a CSS class, a data attribute, or a selector, which matters when a funnel step sits on a page showing customer records. Sensitive query parameters such as tokens and API keys are stripped from captured URLs before they are stored.
The identity you send is the identity you choose to send. Pass an internal user ID rather than an email address if that suits your policy: nothing in funnels, cohorts, or journeys needs personal data to work. Our FAQ covers retention windows and deletion requests in more detail.
It is one product, not a bundle
The analytics share a database with everything else Webrec records. A cohort cell opens session replay. A journey node opens the heatmap for that page. A spike in the errors trend opens the grouped stack traces in error tracking, each one linked to the moment it fired in a recording.
Pricing is per session rather than per seat, so inviting the designer, the support lead, and the engineers who will fix the funnel costs nothing extra. The free plan is 100 sessions a month with every feature and no credit card. Paid plans start at $30 USD a month for 2,500 sessions, then $85 and $250 for the larger tiers. Full detail is on pricing, and the documentation covers the SDK methods. If you are weighing this against another tool, the comparison page is honest about where each one fits.
Questions people ask
How is this different from a standard analytics tool?
Most analytics products end at the chart. Webrec records the session as well, so every funnel step, cohort cell, and journey edge links straight to the recordings behind it. You go from noticing a drop to watching it in about two clicks, without stitching together two vendors and hoping the user IDs line up.
What counts as a user?
That is configurable per project. By default an anonymous visitor counts as a user, which suits marketing sites where most traffic is logged out. Products that identify their users can switch the project to identified-only counting, so anonymous traffic to public pages stops inflating the users figure. The setting only changes how users are counted, not what is recorded.
Do I need to instrument events before I see anything useful?
No. Page views, sessions, devices, countries, errors, and frustration signals are captured from the moment the SDK initialises, which is enough for journeys, trends, and URL-based funnels. Custom events via WebRec.track() are worth adding when you want to record something the DOM does not show, such as a payment confirmed server-side.
What counts as a session?
A session is a single visit, from page load to close. Client-side navigation in a single-page app stays within one session rather than starting a new one, so a visitor moving through ten routes is one session and not ten. Sessions are what your plan is measured in; the pricing page has the per-plan allowances.
Will the SDK slow the app down?
The browser SDK is 50KB gzipped and holds under 1% CPU overhead in normal use. Events are batched and flushed in the background. On high-traffic sites you can sample a percentage of sessions and throttle mouse and scroll capture further.
Can I export the numbers?
Yes. Trends and table data export as CSV, so a number that starts as a chart can end up in a spreadsheet or a board pack. Session data itself stays in the UK unless you export it deliberately.
Build your first funnel today
Add the SDK, let a day of sessions land, then watch the people who dropped. Start with 100 free sessions a month. No credit card, no sales call.